Finance trade manager analyzing stock market indicators for best investment strategy, financial data and charts


1 of 2
More Like This
Finance trade manager analyzing stock market indicators for best investment strategy, financial data and charts


1 of 2
Finance trade manager analyzing stock market indicators for best investment strategy, financial data and charts


1 of 2
Finance trade manager analyzing stock market indicators for best investment strategy, financial data and charts


1 of 2
Finance trade manager analyzing stock market indicators for best investment strategy


1 of 2
Finance trade manager analyzing stock market indicators for best investment strategy style:Photographic width:1344 height:768 aspect:16:9 seed:710236226


1 of 2
Finance trade manager analyzing stock market indicators for best investment strategy, financial data and charts, 16K high resolution, ultra detailed and ultra shapren, high-quality image


1 of 2


Stock market or forex trading graph and chart investmentgrowth. ultra detailed, ultra shapren, medium vibrant saturation and ultra high-quality image


1 of 2
Stock market or forex trading graph and chart investmentgrowth. ultra detailed, ultra shapren, medium vibrant saturation and ultra high-quality image


1 of 2
Stock market or forex trading graph and chart investmentgrowth. ultra detailed, ultra shapren, medium vibrant saturation and ultra high-quality image


1 of 2


Investment and trading chart, stock market fall and loss red graph. Financial crisis, economic problems concept


1 of 2
Investment and trading chart, stock market fall and loss red graph. Financial crisis, economic problems concept


1 of 2
Abstract Stock market forex finance business trading graph infographic futuristic banner background finance investing background with charts data and graphs, 16K ultra high resolution, ultra detailed and ultra shapren, super high-quality image


1 of 2
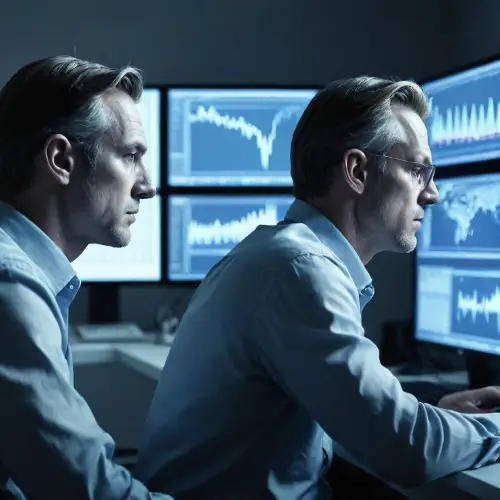
This colour photograph captures the world of online trading, where financial transactions and investments take place in a virtual environment. The scene is set in a sleek and modern home office, where a man sits focused in front of a computer screen. You can see the tension and concentration in his face as he analyses market data and navigates through various trading platforms. The room is full of advanced technology and multiple screens display real-time stock prices, charts and news. The colour palette of the photograph is mainly made up of blue and grey tones, creating a modern atmosphere. The lighting highlights the person's face and computer equipment in detail. The composition of the photograph centres around the man, emphasising the importance of his decision-making process in the world of online trading.


1 of 2
Graphs for business, the stock market, or forex trading that are suited for financial investments, 16K high resolution, ultra detailed and ultra shapren, high-quality image


1 of 2
stock market trading investment stick graph. Finance and economy concept, 16K high resolution, ultra detailed and ultra shapren, high-quality image


1 of 2


Finance crisis chart stock market business background. Diagram indicator shiny glow data visualization, 16K high resolution, ultra detailed and ultra shapren, high-quality image


1 of 2
Finance crisis chart stock market business background. Diagram indicator shiny glow data visualization, 16K high resolution, ultra detailed and ultra shapren, high-quality image


1 of 2
Stock market investment trading graph growth.Investment finance chart,stock market business and exchange financial growth graph, 16k ultra high resolution, very sharp, ultra high detailed image


1 of 2
Stock market investment trading graph growth.Investment finance chart,stock market business and exchange financial growth graph, 16k ultra high resolution, very sharp, ultra high detailed image


1 of 2
Stock market investment trading graph growth.Investment finance chart,stock market business and exchange financial growth graph, 16k ultra high resolution, very sharp, ultra high detailed image


1 of 2
Stock market investment trading graph growth. Investment finance chart,stock market business and exchange financial growth graph, 16k ultra high resolution, very sharp, ultra high detailed image


1 of 2
Finance crisis chart stock market business background. Diagram indicator shiny glow data visualization, 16K ultra high resolution, ultra detailed and ultra shapren, super high-quality image


1 of 2
Finance crisis chart stock market business background. Diagram indicator shiny glow data visualization, 16K ultra high resolution, ultra detailed and ultra shapren, super high-quality image


1 of 2
Finance crisis chart stock market business background. Diagram indicator shiny glow data visualization, 16K ultra high resolution, ultra detailed and ultra shapren, super high-quality image


1 of 2
Bull stock market trading investment stick graph. Finance and economy concept, 16K high resolution, ultra detailed and ultra shapren, high-quality image


1 of 2
Bull stock market trading investment stick graph. Finance and economy concept, 16K high resolution, ultra detailed and ultra shapren, high-quality image


1 of 2
Bull stock market trading investment stick graph. Finance and economy concept, 16K high resolution, ultra detailed and ultra shapren, high-quality image


1 of 2


bullish market trends, rising financial charts, positive economic indicators, stock market optimism, 4K resolution, high-detail financial chart illustration, best quality, by BullRun Visuals


1 of 2
Stock market bull market trading up trend of graph green background rising price generative ai


1 of 2


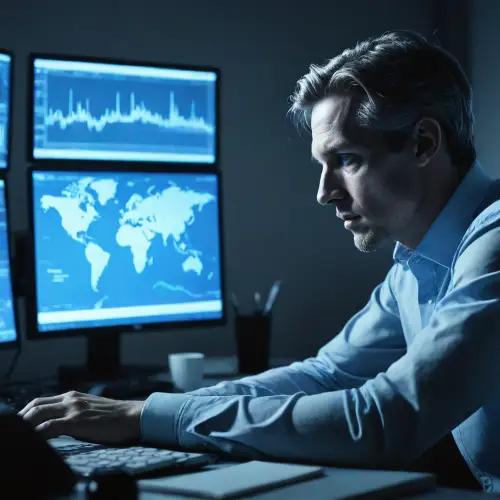
the world of online trading, financial transactions and investments take place in a virtual environment. A man sits at a computer in a modern home office, concentrating on analysing market data and trading platforms. The room is full of modern technology, with multiple monitors displaying data. The photo is in blue-grey tones. The lighting highlights the man's face and the technology. Composition around the man

1 of 2
trading charts featuring vibrant colors (1748c1, 87ceea, 01004c), energetic composition, currency symbols, and educational elements, creative visual representation for learning how to trade:: Camera and lens specifications not applicable ,


1 of 2
trading charts featuring vibrant colors (1748c1, 87ceea, 01004c), energetic composition, currency symbols, and educational elements, creative visual representation for learning how to trade:: Camera and lens specifications not applicable ,


1 of 2
an impactful visual representation capturing the essence of outstanding stocks in 2024


1 of 2


generete a cover picture for a programmer and stock market trader with stock chart and programming stuff


1 of 2